

* 오류가 있을수 있고, 자기가 확인해보셔야합니다.
1. 가속(60%)
2. 특화(20%)
3.치명 = 유연 (10%)
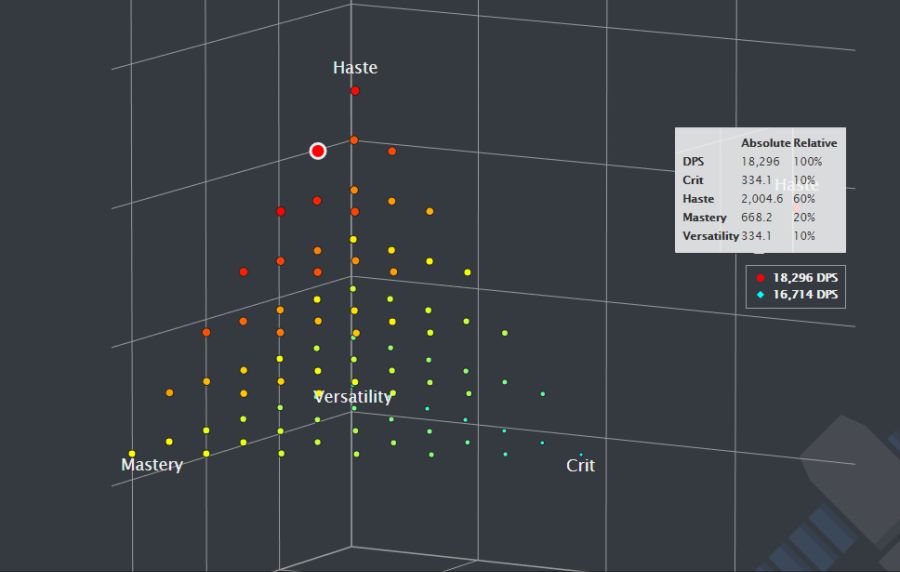
The chart shows the simulated DPS of different secondary distributions of the otherwise same profile. If the profile has for example 1000 secondary stats, a dot (profile) with a Relative value of 30% in crit uses 300 of that rating as its crit rating to run a simulation. The resulting DPS is shown as the color. Red is the best result, blue the worst. Most of the time best and worst are pretty close.